| You are currently reading our legacy website. You can view our current projects here: |
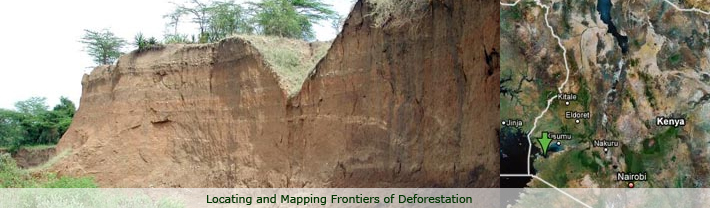
LOCATING THE FRONTIERS OF DEFORESTATION
Kakamega Forest - Kenya; Evidence from multi-date satellite imagery and tree-structured classifiers.
In
view of the manifold benefits that are attributable to forests, their
progressive depletion must rank high in the global research and development
agenda. Here, we present a summary of findings related to deforestation
and soil degradation from the Kakamega Forest in Kenya and the Eastern
Rainforests of Madagascar.
A significant proportion of the original forest in the Kakamega, South Nandi and North Nandi forest blocks is being lost primarily due to cultivation encroachment, settlement and to a small extent, government sanctioned deforestation for commercial tea production. This loss exerts an enormous influence on basin hydrology, climate and global biogeochemical cycles.
There is urgent need to focus on the principal loci of deforestation, i.e the main deforestation fronts. An alert strategy through remote sensing (the most comprehensive and objective source of data now available) would greatly enhance our capacity to understand the character and scale of deforestation in the principal localities. This strategy would highlight those areas where safeguarding measures are needed and where there will be the biggest payoff from timely intervention.
The overall objective of the study was to provide an alerting strategy, based on remote sensing and statistical tree structured analysis tools, to identify deforestation fronts, both present and prospective.
Image processing
An important step in monitoring vegetation change is the ability to compare changes in light reflectance among or between images from different dates and sites in different scenes. These comparisons require that digital numbers from each scene be transformed to common reference values through calibration. A calibration process was applied to raw images to remove time and scene dependent effects caused by atmospheric scattering, solar illumination angle and sensor decay through time.
 A
total of 42 pseudo invariant features (PIFs), which are objects spatially
well defined, spectrally and radiometrically stable were identified. The
digital numbers of these invariant features were extracted from Landsat
TM 1986 and Landsat ETM 2000 using bands 1, 2, 3, 4, 5 and 7.
A linear regression was applied to the resulting values file using Landsat ETM
2000 as the reference image (independent variable) and
Landsat TM 1986 as the overpass image (dependent variable). The
slope and intercept of the regression line, referred to as gain and offset
respectively were used to calibrate the image dates. A
total of 42 pseudo invariant features (PIFs), which are objects spatially
well defined, spectrally and radiometrically stable were identified. The
digital numbers of these invariant features were extracted from Landsat
TM 1986 and Landsat ETM 2000 using bands 1, 2, 3, 4, 5 and 7.
A linear regression was applied to the resulting values file using Landsat ETM
2000 as the reference image (independent variable) and
Landsat TM 1986 as the overpass image (dependent variable). The
slope and intercept of the regression line, referred to as gain and offset
respectively were used to calibrate the image dates.
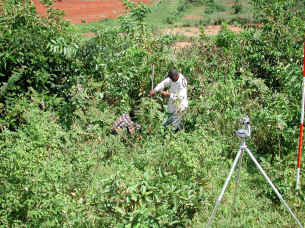
Selection of training sites
The following forest cover categories were considered
for selection of training sites: (1) Forest that remained forest
(f). (2) Non- forest that remained non- forest (nf). (3) Non- forest
that changed to forest or regeneration/re-growth (r). (4) Forest
that changed to non- forest (d). Then 72 training sites were randomly
selected for each category by visual assignment based on bands 4,
3, 2 composite of the two image dates. The training sites were used
to extract reflectance from bands 1, 2, 3, 4, 5, and band7 using
Landsat TM 86 and Landsat ETM 2000. Back to top 
Classification Tree
Classification and Regression Tree (CART®
Version. 4.0) statistical software was used to analyze reflectance
data extracted from each band for the two image dates using the
respective forest cover category training sites (f, nf,d and r).
CART’s major role was to produce an accurate set of data classifiers
by uncovering the predictive structure of reflectance data. The
initial node on a tree is called the root. From the root, the model
was fit using a binary recursive partitioning.
Findings
Classification rules and tree topology
From
the initial node on the tree, the data was successively broken into
left and right branches with the splitting rules defined by the
predictor variable, reflectance.
Forest Change Dynamics
The classification rule defining each splitting
node was used to process four binary images through image band reclassification.
These were subsequently combined using image cross tabulation module
in IDRISI 32. Reclassification was applied again to make the respective
class assignments. Back to top
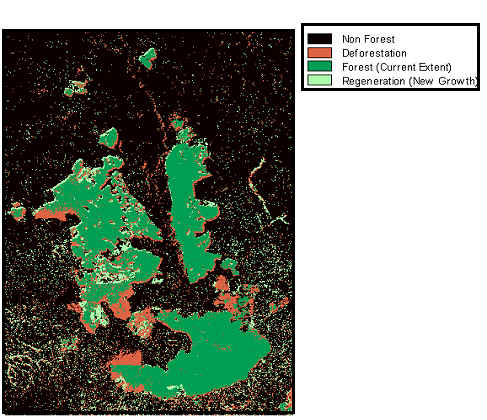
Classification accuracy
100% of the non-forest and deforested pixels were
classified correctly. 98.64% and 96.33% of forest and forest re-growth
pixels respectively were classified correctly. Cross validation
using 50 randomly held segment reveals prediction success probabilities
of 0.99 for forest and deforested pixels.
.
Non-forest
and forest re-growth pixels had prediction success of 0.96 and 0.93
respectively.
Conclusion
This study provides
one of the most objective and comprehensive approaches for locating
the frontiers of tropical deforestation. It provides a rational
spatial sampling domain for addressing the main causes of deforestation;
historical, present and prospective. These results will also guide
the implementation of replicated spatial analogue surveys designed
to assess the impacts of forest conversion on soil productivity
(greenhouse bioassay), carbon, macronutrient stocks (N, P, K, S,
CEC) and soil physical properties (bulk density, water stable aggregates,
texture). Back to top
|