| You are currently reading our legacy website. You can view our current projects here: |
SPECTRAL DETECTION OF SOIL EROSION PHASE TRANSITIONSThe spectral screening test presented here provides a robust and repeatable measurement of soil erosion which can be used to:
in which αsed represents the fractional abundance of the sediment-like component (S).Based on this formulation, progressive soil erosion is expected to decrease ased, causing B to converge toward U over time. The opposite effect would be expected to occur under depositional conditions. Values for ased can orthogonal projection of B onto S and the contribution of U can be estimated as the complement of this (see Harsanyi and Chang, 1994 and Settle, 1996 for two different but numerically equivalent derivations of this). Thus from a linear mixing perspective, ased may viewed as a least-squares estimate of ased in the regression equation:
and
therefore the unconstrained LS-estimate of αsed for the two-component
mixture is given by:
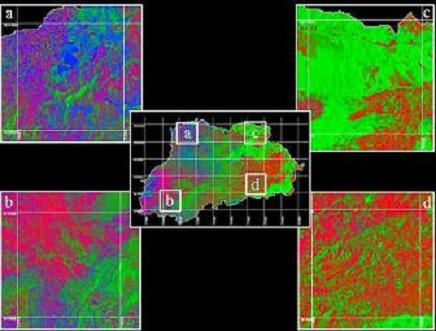
in which w represents the wavelength.Diffuse reflectance measurements of sediments sampled at the outlet of the River Nyando watershed (~3650 km2) draining into the Winam Gulf of Lake Victoria in western Kenya were unmixed from equivalent measurements performed on topsoils sampled across a wide range of geological and environmental conditions in the watershed. Values for ased were calculated as above, based on a core averaged sediment spectrum.Samples were then grouped on field observations, sorted by ased, and displayed as images for data exploration (see below). Each row in the figure represents an individual soil or sediment spectrum, and each column a specific wavelength.The color scheme, from hot (white, yellow) to cool (dark blue, black), is scaled to emphasize high (hot) versus low (cool) 1st derivative reflectance values. All samples are sorted based on decreasing values ased (top-to-bottom in each panel).The figures show striking visual differences between samples collected from depositional, apparently intact, and erosional environments. Notably these patterns are not expressed on individual wavelengths, but rather as complex changes in the shapes of broader absorption features occurring along the entire spectral range covered by this dataset. While the images generally support the notion of gradual spectral transitions between erosional and depositional cases, they also highlight the fact that there is considerable spectral variation within categories defined by the field observations.Back to top
Diffuse reflectance spectra of soil and sediment samples originating from the Nyando River Basin. (a) sediment samples, (b) sheet and rill eroded soils, (c) hardset soils, (d) gully eroded soils, (e) apparently intact soil.SPECTRAL EROSION INDEX CALIBRATES TO PLANT PRODUCTIVITYWe conducted a bioassay to asses relative effects of soil erosion index on plant productivity. We grew maize plants in pots for about two weeks on 300 soils sampled from the margins of the Kakamega Forest in western Kenya. The topsoil samples were assigned to erosional, stable or depositional classes based on our spectral screening test.Plant productivity, after allowing for differences in emergence and initial seed weight (residual biomass in figure below), was significantly different among the soil erosion classes. Root-shoot ratio, a sensitive indicator of nutrient stress in plants, was also completely separable among the soil classes.These results indicate that the spectral index of erosion is also an indicator of soil capacity to support plant growth
Effect of soil erosion class on time to emergence, total biomass, root-shoot ratio and residual biomass in a plant growth bioassay.Soil classes: E = Erosional S = Stable D = DepositionalSURVEILLANCE OF SOIL EROSIONSoil Erosion PhasesSoil erosional, stable and depositional phases in the River Nyando Basin were mapped out through calibration of the spectral index of soil erosion (above) to Landsat 7 pixel reflectance values. We used an ordinal logistic classification procedure to assess the spatial distribution of soil condition classes based on observations from 522 georeferenced plots (1567 topsoil samples). Because of the change in geometric support in the measurements (i.e., Landsat reflectance values were measured at the level of 30 x 30 m pixels, whereas soils were classified at the level of samples within pixels), the classifier was fit in MIXOR©, and the resulting model equations were transferred to the IDRISI32 GIS system for display.Back to top  Example of mapping of erosion-deposition
phases and depositional gradient in Nyando River basin.
The original images were calibrated using empirical line calibration from field spectra collected from light and dark targets. Georeferencing was accomplished using GPS ground control points located at prominent road intersections in the images. No additional terrain correction was applied due to the lack of a suitably high resolution digital elevation model for this area. Pixel reflectance values at georeferenced sites where then extracted from the images.The resulting map of soil erosion phases was used to set up a sampling frame for baseline studies as a basis for prospective studies. Four 10 x 10 km blocks were located so as to sample the maximum amount of variation in erosion phases.
Map of soil erosion phases is used to establish sampling blocks for prospective studiesPREVALENCE OF SOIL PHYSICAL DEGRADATION PROBLEMS Spatial distribution of soil physical degradation risk in the Nyando River BasinThe 95% confidence limits of prevalence of soil physical degradation in the Nyando Basin are 40 – 53%:sheet and rill erosion: 16.5
- 29.8% |
|